Volatility-Based Profit Targets: How Far Can Price Realistically Go?
Most traders use horizontal levels to set profit targets. But price isn't attracted to lines—price seeks liquidity. And it performs this search through the natural ebb and flow visible on all price charts.
This ebb and flow forms price waves, which tend to behave in consistent ways. One of those tendencies is how far they will travel before pausing or reversing. This article explores how volatility can help shape more realistic profit expectations.
The Nature of Waves
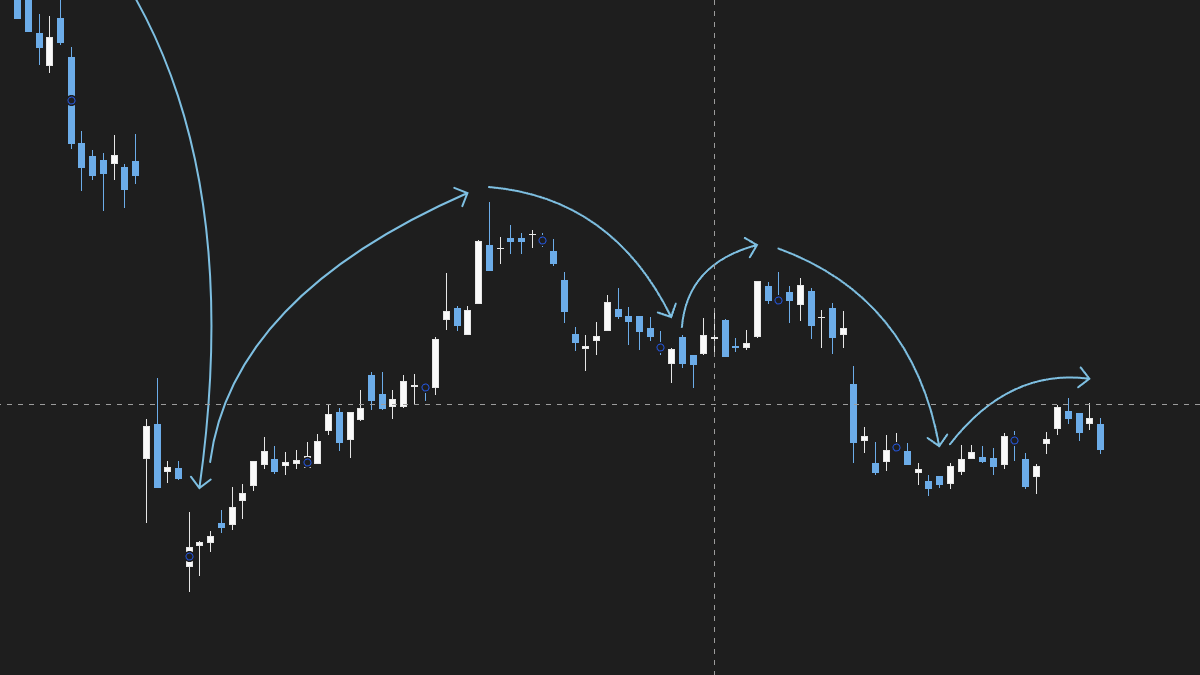
Price moves in impulses and corrections.
As a rule of thumb:
- An impulsive wave advances the trend.
- A corrective wave pauses or retraces it temporarily.
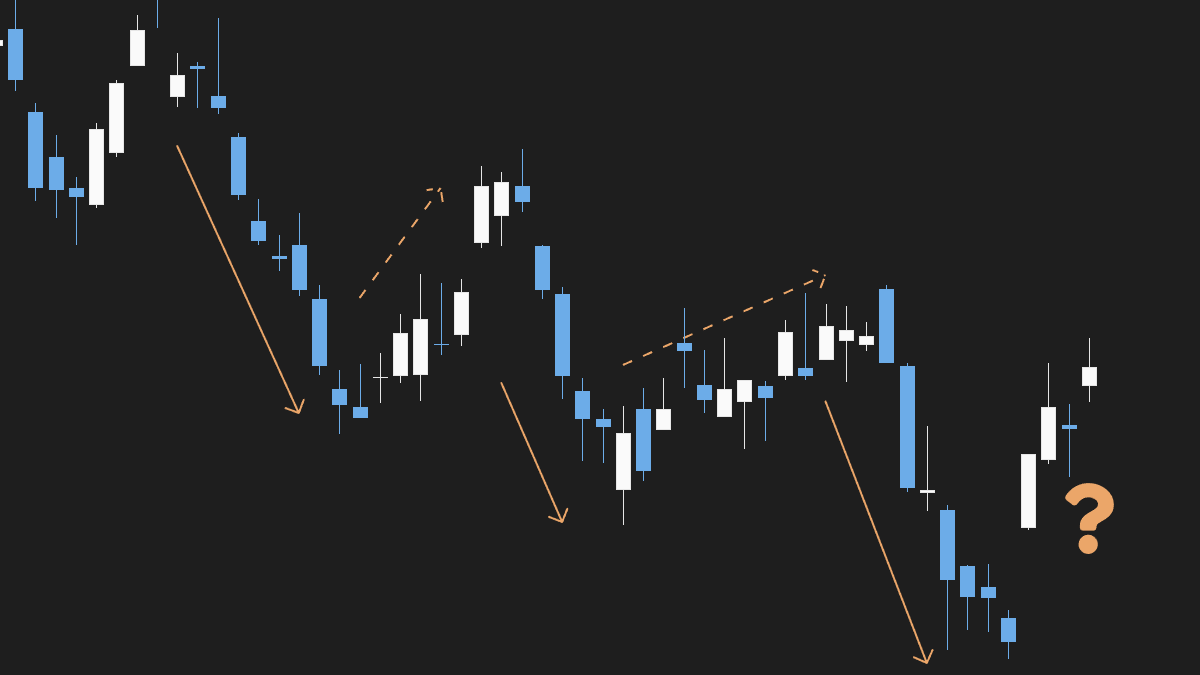
In the image below, we see impulsive waves (solid) and corrective waves (dashed).
Notice the question mark (?). We don’t yet know if this is just a pause in the current trend—or the start of a reversal.
We can study these waves and begin to analyze what is typical versus atypical behavior.
Some of the questions we want to ask are:
- At what point is the wave over and a new one beginning?
- How long does a typical wave last?
- How far does a typical wave travel?
It’s that last question I want to help you build a framework around answering.
Measuring Volatility
Volatility is the measurement of dispersion—how far price tends to deviate from its average behavior.
A common statistical way to measure this is standard deviation. But in trading, we often prefer a more intuitive tool: Average True Range (ATR).
ATR measures the average size of price movements over a set period. It differs slightly from a candle’s range (high minus low) by also accounting for gaps, making it more robust.
The ebb and flow of market waves is a function of volatility, so it makes sense to measure them with volatility-based tools. ATR can help us estimate how far a typical wave is likely to go.
If we analyze enough wave data in a given market, we start to see tendencies. For example, we might find that most impulsive waves travel about 4 ATRs from their apex. If a current wave has already moved that far, expecting much more may be unrealistic.
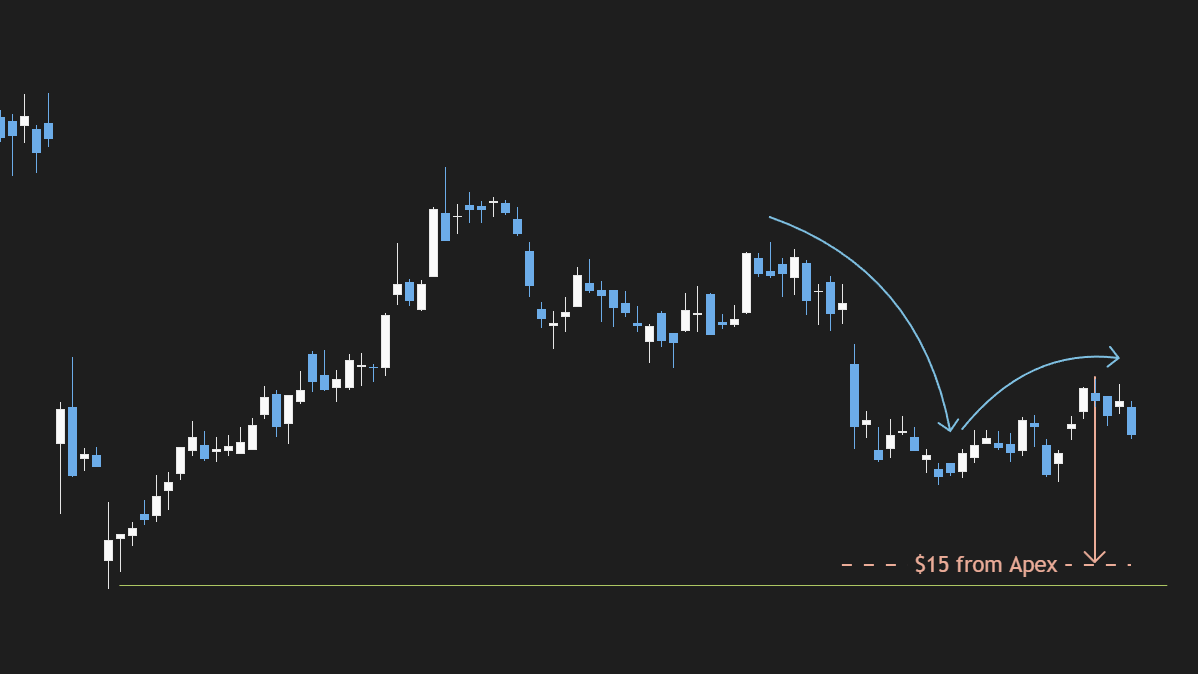
A Practical Example
Imagine we’re in a trade, and based on our research, we know that waves in this market tend to travel about 5 ATRs. If the ATR at the wave’s apex is $3.00, then our volatility-based target is about $15 away. That gives us a concrete level to work with—shown here aligning with a prior swing low.
This doesn’t mean we ignore support or resistance. But they’re just imaginary lines until price confirms them. Volatility helps give those levels context.
Setting Realistic Targets
Volatility has key implications for our trades—especially as swing traders.
If 75% of waves don’t go beyond 6 ATRs, then setting an 8-ATR profit target isn't just ambitious—it’s statistically unlikely. Volatility doesn’t guarantee outcomes, but it shapes probabilities.
Support and resistance levels provide confluence, but volatility provides context. When we start viewing targets through the lens of how far price usually travels—not just where we hope it might go—we begin trading with the market, not against it. By incorporating volatility into our profit targets, we shift from hopeful guesses to informed expectations. That edge may be subtle, but over time, it adds up.